States / West Virginia
West Virginia
Registration deadlines and voting rules: official guide for West Virginia on vote.gov.
West Virginia's government
State executive
Lieutenant Governor/Senate PresidentRandy SmithRepublicanSecretary of StateKris WarnerRepublicanAttorney GeneralNot available yetState legislature
2 Democratic32 Republican
9 Democratic91 Republican
Control: Republican
Source: National Governors Association (retrieved November 21, 2026); National Lieutenant Governors Association (retrieved November 21, 2026); National Association of Secretaries of State (retrieved November 21, 2026); National Conference of State Legislatures (retrieved November 21, 2026). The Attorney General is not shown yet: no source we can use lists every state's, so each is added from that office's own website.
West Virginia in the U.S. Congress
Who represents West Virginia in Washington now. Open anyone to see their votes, bills, money and term dates.
Senate
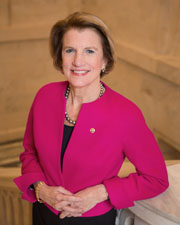
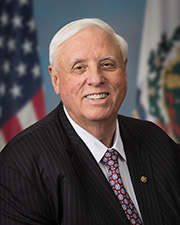
House of Representatives (2)
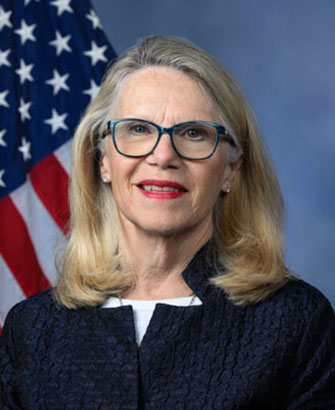 Carol D. MillerRepresentative, 1st districtRepublican
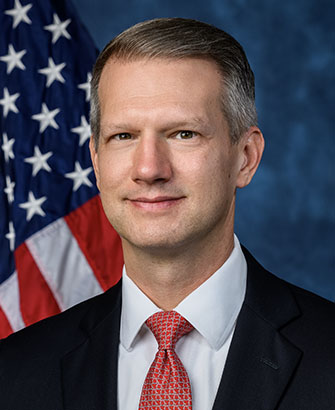 Riley M. MooreRepresentative, 2nd districtRepublican
Source: @unitedstates project (public-domain compilation of official congressional records) (retrieved November 21, 2026); Clerk of the U.S. House of Representatives (retrieved November 21, 2026); Biographical Directory of the United States Congress (retrieved November 21, 2026). Sitting members. Anyone elected on November 3, 2026 takes office on January 3, 2027.
Past elections in West Virginia
Turnout and results from earlier elections. Open a section to see it.
Voter turnout
Ballots counted in each November general election as a share of people eligible to vote in West Virginia.
| Year | Ballots counted | Eligible voters | Turnout |
|---|---|---|---|
| 2024 | 770,587 | 1,389,555 | 55.5% |
| 2022 | 494,753 | 1,393,321 | 35.5% |
| 2020 | 802,726 | 1,403,699 | 57.2% |
| 2018 | 597,149 | 1,409,691 | 42.4% |
| 2016 | 732,362 | 1,424,155 | 51.4% |
| 2014 | 462,864 | 1,440,331 | 32.1% |
| 2012 | 685,099 | 1,446,756 | 47.4% |
| 2010 | 536,493 | 1,444,109 | 37.1% |
| 2008 | 731,691 | 1,430,218 | 51.2% |
| 2006 | 473,014 | 1,417,996 | 33.4% |
| 2004 | 769,645 | 1,407,450 | 54.7% |
| 2002 | 440,156 | 1,396,182 | 31.5% |
| 2000 | not published | 1,388,515 | not published |
| 1998 | 405,139 | 1,388,822 | 29.2% |
| 1996 | 653,331 | 1,386,888 | 47.1% |
| 1994 | 439,551 | 1,379,231 | 31.9% |
| 1992 | not published | 1,364,890 | not published |
| 1990 | not published | 1,348,243 | not published |
| 1988 | not published | 1,348,148 | not published |
| 1986 | 449,249 | 1,370,831 | 32.8% |
| 1984 | not published | 1,392,024 | not published |
| 1982 | not published | 1,399,967 | not published |
| 1980 | 742,150 | 1,386,555 | 53.5% |
Source: University of Florida Election Lab (retrieved November 21, 2026). Every election from the first year with published figures for this state. Blank years say “not published”.
Presidential election results
Votes cast in West Virginia in each presidential general election since 1976, most recent first.
2024 · 762,584 votes
- Donald J. Trump · Republican69.97% (533,556)
- Kamala D. Harris · Democratic28.10% (214,309)
- Robert F. Kennedy Jr. · Other1.17% (8,947)
- 33 other entries under 1% each0.76% (5,772)
2020 · 794,652 votes
- Donald J. Trump · Republican68.63% (545,382)
- Joseph R. Biden Jr. · Democratic29.70% (235,984)
- Jo Jorgensen · Libertarian1.34% (10,687)
- 1 other entry under 1% each0.33% (2,599)
2016 · 713,051 votes
- Donald J. Trump · Republican68.63% (489,371)
- Hillary Clinton · Democratic26.48% (188,794)
- Gary Johnson · Libertarian3.23% (23,004)
- Jill Stein · Other1.13% (8,075)
- 1 other entry under 1% each0.53% (3,807)
2012 · 670,438 votes
- Mitt Romney · Republican62.30% (417,655)
- Barack H. Obama · Democratic35.54% (238,269)
- 3 other entries under 1% each2.16% (14,514)
2008 · 713,451 votes
- John McCain · Republican55.71% (397,466)
- Barack H. Obama · Democratic42.59% (303,857)
- Ralph Nader · Other1.01% (7,219)
- 3 other entries under 1% each0.69% (4,909)
2004 · 755,792 votes
- George W. Bush · Republican56.07% (423,778)
- John Kerry · Democratic43.21% (326,541)
- 3 other entries under 1% each0.72% (5,473)
2000 · 648,124 votes
- George W. Bush · Republican51.92% (336,475)
- Al Gore · Democratic45.59% (295,497)
- Ralph Nader · Other1.65% (10,680)
- 4 other entries under 1% each0.84% (5,472)
1996 · 636,459 votes
- Bill Clinton · Democratic51.51% (327,812)
- Robert Dole · Republican36.76% (233,946)
- Ross Perot · Other11.26% (71,639)
- 1 other entry under 1% each0.48% (3,062)
1992 · 683,677 votes
- Bill Clinton · Democratic48.41% (331,001)
- George H.W. Bush · Republican35.39% (241,974)
- Ross Perot · Other15.92% (108,829)
- 1 other entry under 1% each0.27% (1,873)
1988 · 653,311 votes
- Michael Dukakis · Democratic52.20% (341,016)
- George H.W. Bush · Republican47.46% (310,065)
- 1 other entry under 1% each0.34% (2,230)
1984 · 735,742 votes
- Ronald Reagan · Republican55.11% (405,483)
- Walter Mondale · Democratic44.60% (328,125)
- 3 other entries under 1% each0.29% (2,134)
1980 · 737,715 votes
- Jimmy Carter · Democratic49.81% (367,462)
- Ronald Reagan · Republican45.30% (334,206)
- John B. Anderson · Other4.30% (31,691)
- 1 other entry under 1% each0.59% (4,356)
1976 · 750,590 votes
- Jimmy Carter · Democratic58.07% (435,864)
- Gerald Ford · Republican41.93% (314,726)
Source: MIT Election Data and Science Lab (retrieved November 21, 2026). Where a candidate appeared on more than one party line, the lines are added together. Entries under 1% are grouped.
U.S. Senate election results
The six most recent Senate contests in West Virginia through 2024. A runoff, where one was held, decides the seat.
2024 general election · 747,717 votes
- Jim Justice · Republican68.75% (514,079)
- Glenn Elliott · Democratic27.76% (207,548)
- David Moran · Libertarian3.49% (26,075)
- 1 other entry under 1% each0.00% (15)
2020 general election · 778,918 votes
- Shelley Moore Capito · Republican70.28% (547,454)
- Paula Jean Swearengin · Democratic27.00% (210,309)
- David Moran · Libertarian2.72% (21,155)
2018 general election · 582,911 votes
- Joe Manchin · Democratic49.55% (288,808)
- Patrick Morrisey · Republican46.30% (269,872)
- Rusty Hollen · Libertarian4.16% (24,231)
2014 general election · 453,689 votes
- Shelley Moore Capito · Republican62.12% (281,820)
- Natalie Tennant · Democratic34.46% (156,360)
- John S. Buckley · Libertarian1.63% (7,409)
- Bob Henry Baber · Other1.21% (5,504)
- 2 other entries under 1% each0.57% (2,596)
2012 general election · 660,202 votes
- Joe Manchin III · Democratic60.57% (399,898)
- John R. Raese · Republican36.47% (240,787)
- Bob Henry Baber · Other2.96% (19,517)
2010 special general election · 529,948 votes
- Joe Manchin III · Democratic53.47% (283,358)
- John R. Raese · Republican43.40% (230,013)
- Jesse Johnson · Other1.92% (10,152)
- Jeff Becker · Other1.21% (6,425)
Source: MIT Election Data and Science Lab (retrieved November 21, 2026). Primary elections are not included. Entries under 1% are grouped.