States / California
California
Registration deadlines and voting rules: official guide for California on vote.gov.
California's government
State executive
Lieutenant GovernorEleni KounalakisDemocraticSecretary of StateShirley WeberDemocraticAttorney GeneralRob BontaState legislature
30 Democratic10 Republican
60 Democratic19 Republican1 vacant
Control: Democratic
Source: National Governors Association (retrieved November 21, 2026); National Lieutenant Governors Association (retrieved November 21, 2026); National Association of Secretaries of State (retrieved November 21, 2026); Office of the Attorney General of California (retrieved November 22, 2026); National Conference of State Legislatures (retrieved November 21, 2026). The Attorney General is named on the office's own website, which does not give a party.
California in the U.S. Congress
Who represents California in Washington now. Open anyone to see their votes, bills, money and term dates.
Senate
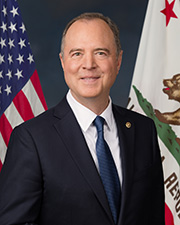
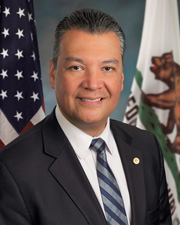
House of Representatives (52)
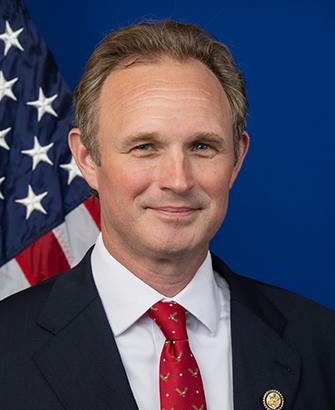 James GallagherRepresentative, 1st districtRepublican
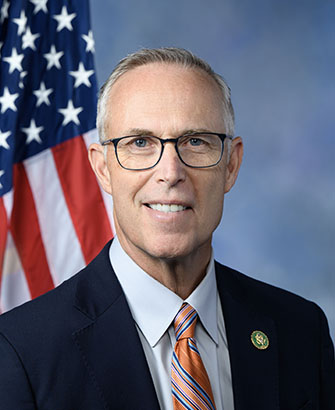 Jared HuffmanRepresentative, 2nd districtDemocratic
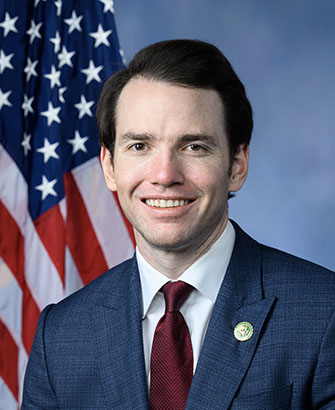 Kevin KileyRepresentative, 3rd districtIndependent(caucuses with Republican)
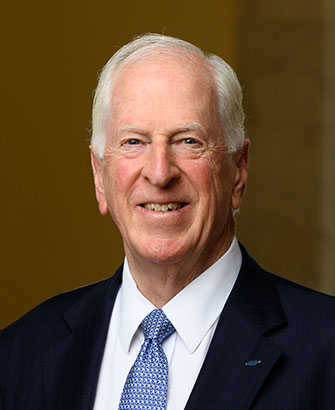 Mike ThompsonRepresentative, 4th districtDemocratic
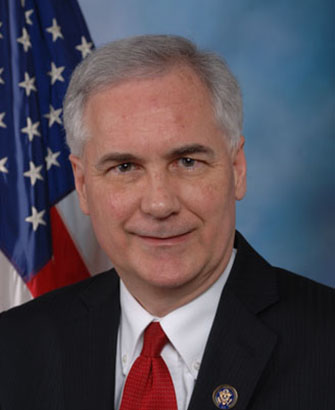 Tom McClintockRepresentative, 5th districtRepublican
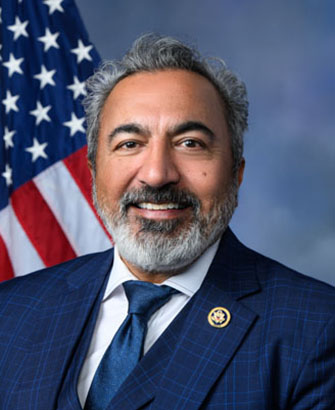 Ami BeraRepresentative, 6th districtDemocratic
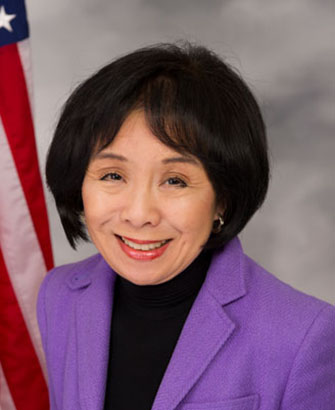 Doris O. MatsuiRepresentative, 7th districtDemocratic
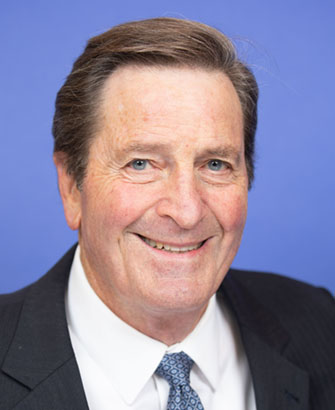 John GaramendiRepresentative, 8th districtDemocratic
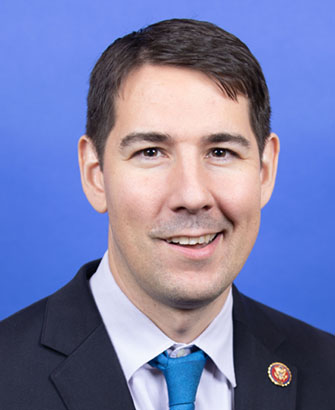 Josh HarderRepresentative, 9th districtDemocratic
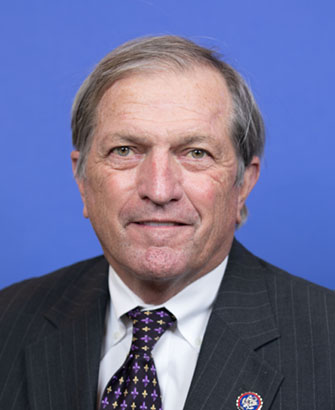 Mark DeSaulnierRepresentative, 10th districtDemocratic
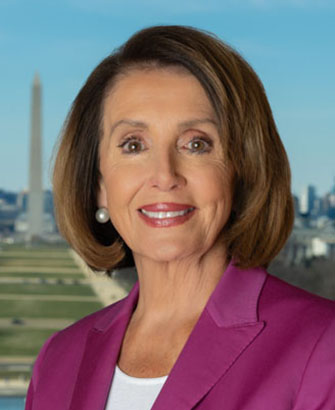 Nancy PelosiRepresentative, 11th districtDemocratic
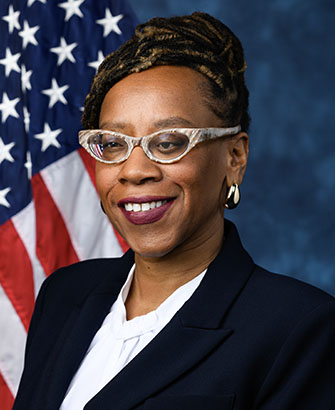 Lateefah SimonRepresentative, 12th districtDemocratic
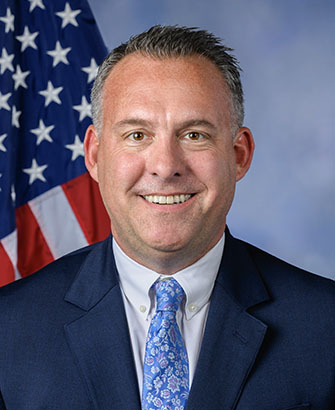 Adam GrayRepresentative, 13th districtDemocratic
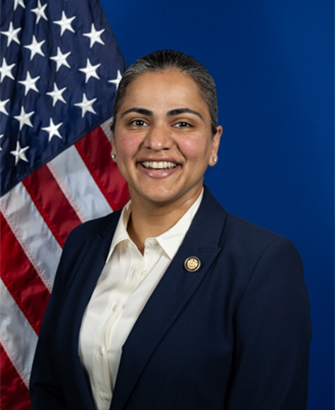 Aisha WahabRepresentative, 14th districtDemocratic
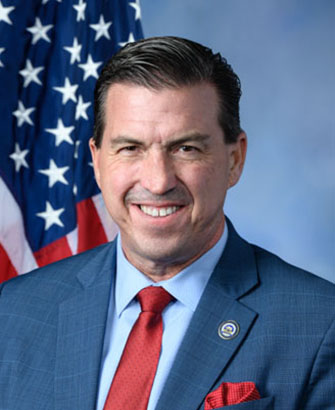 Kevin MullinRepresentative, 15th districtDemocratic
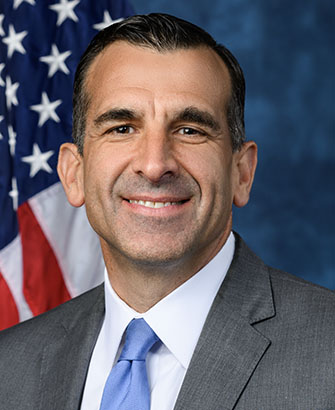 Sam T. LiccardoRepresentative, 16th districtDemocratic
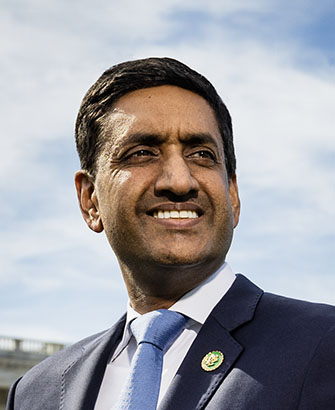 Ro KhannaRepresentative, 17th districtDemocratic
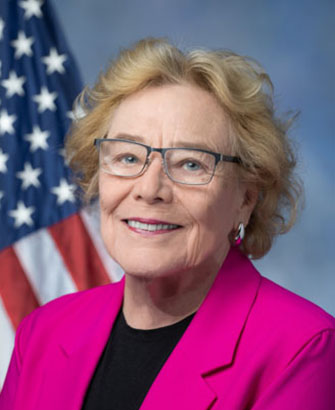 Zoe LofgrenRepresentative, 18th districtDemocratic
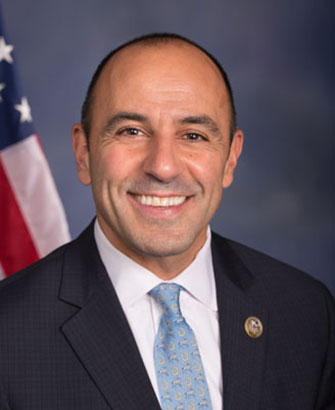 Jimmy PanettaRepresentative, 19th districtDemocratic
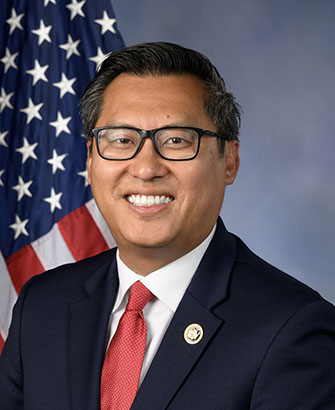 Vince FongRepresentative, 20th districtRepublican
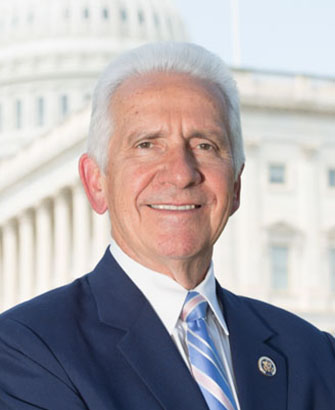 Jim CostaRepresentative, 21st districtDemocratic
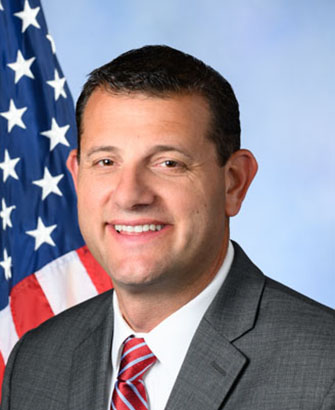 David G. ValadaoRepresentative, 22nd districtRepublican
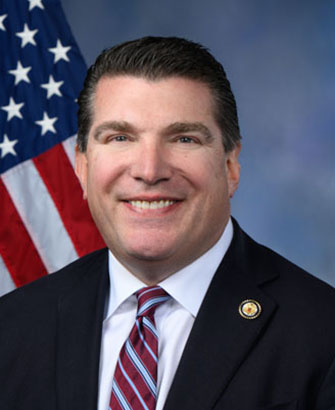 Jay ObernolteRepresentative, 23rd districtRepublican
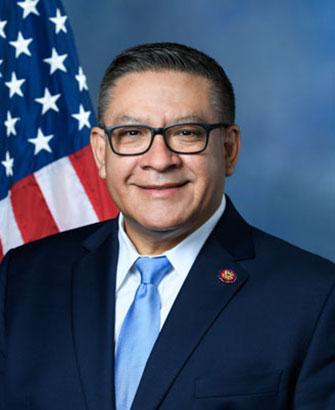 Salud O. CarbajalRepresentative, 24th districtDemocratic
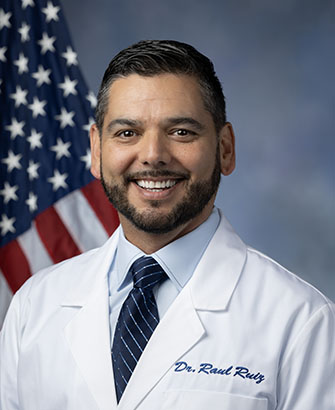 Raul RuizRepresentative, 25th districtDemocratic
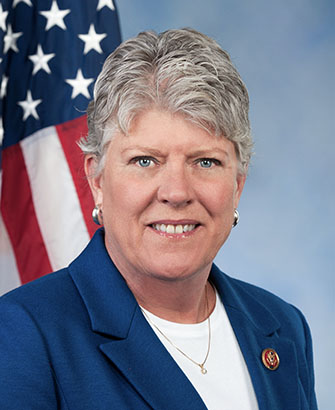 Julia BrownleyRepresentative, 26th districtDemocratic
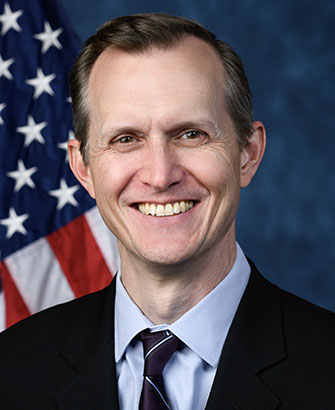 George WhitesidesRepresentative, 27th districtDemocratic
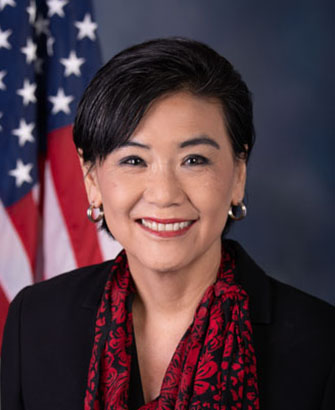 Judy ChuRepresentative, 28th districtDemocratic
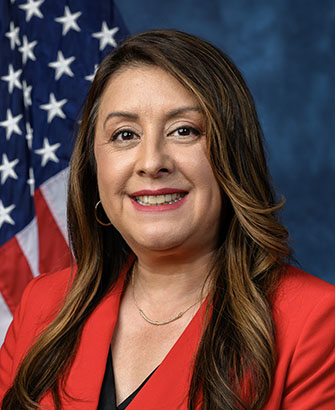 Luz M. RivasRepresentative, 29th districtDemocratic
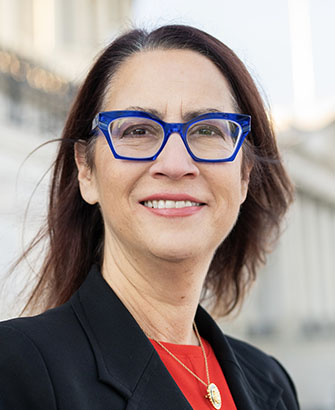 Laura FriedmanRepresentative, 30th districtDemocratic
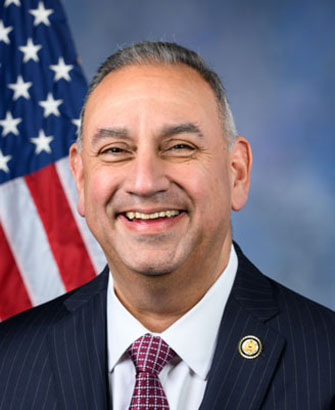 Gilbert Ray Cisneros, Jr.Representative, 31st districtDemocratic
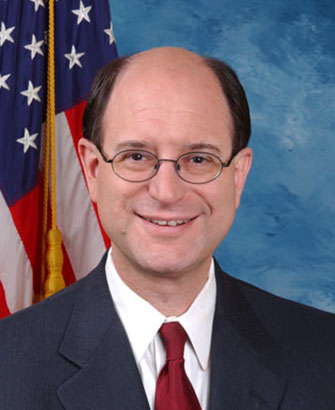 Brad ShermanRepresentative, 32nd districtDemocratic
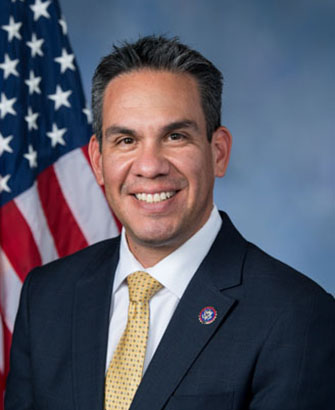 Pete AguilarRepresentative, 33rd districtDemocratic
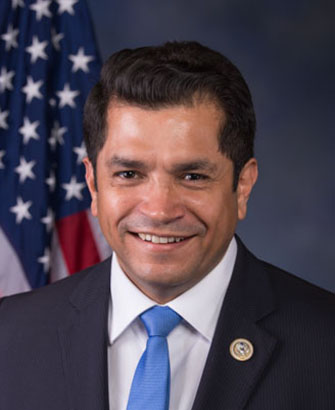 Jimmy GomezRepresentative, 34th districtDemocratic
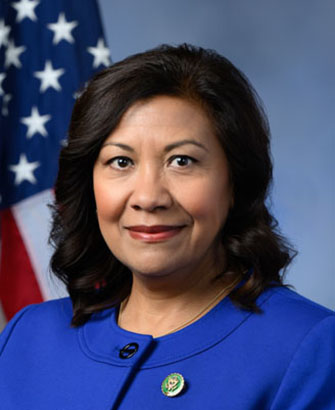 Norma J. TorresRepresentative, 35th districtDemocratic
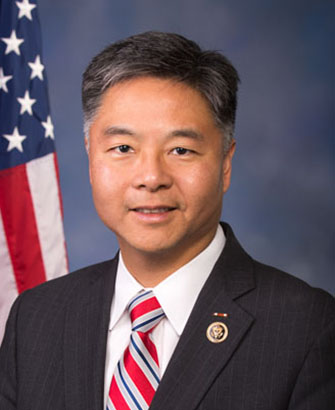 Ted LieuRepresentative, 36th districtDemocratic
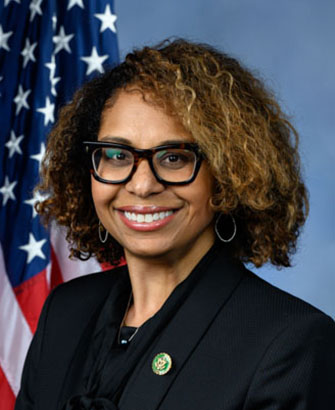 Sydney Kamlager-DoveRepresentative, 37th districtDemocratic
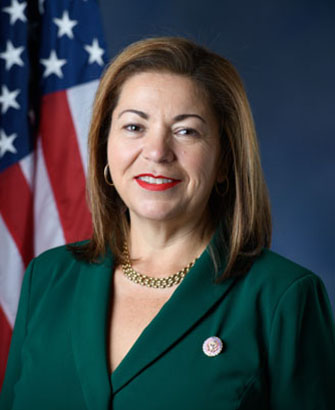 Linda T. SánchezRepresentative, 38th districtDemocratic
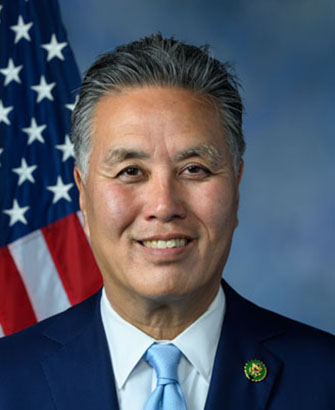 Mark TakanoRepresentative, 39th districtDemocratic
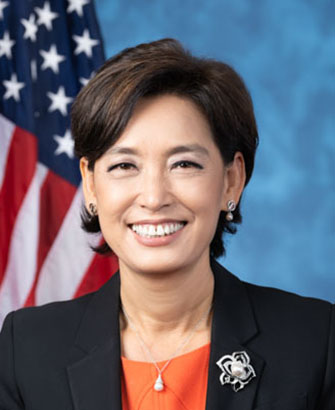 Young KimRepresentative, 40th districtRepublican
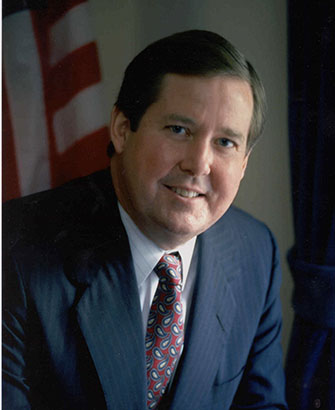 Ken CalvertRepresentative, 41st districtRepublican
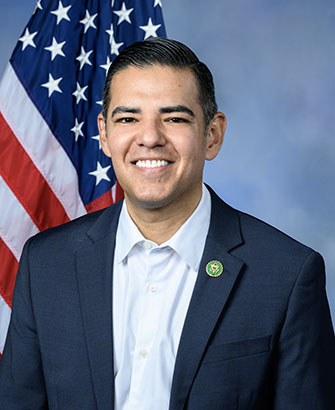 Robert GarciaRepresentative, 42nd districtDemocratic
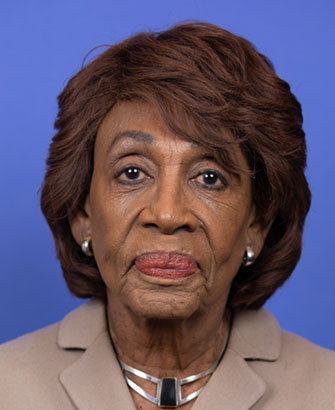 Maxine WatersRepresentative, 43rd districtDemocratic
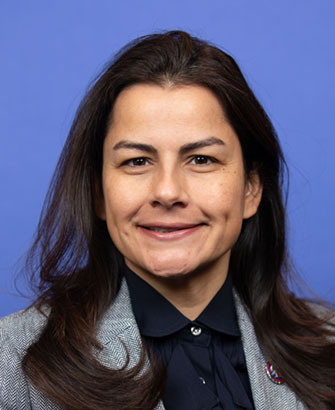 Nanette Diaz BarragánRepresentative, 44th districtDemocratic
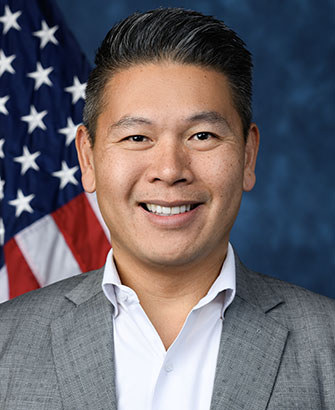 Derek TranRepresentative, 45th districtDemocratic
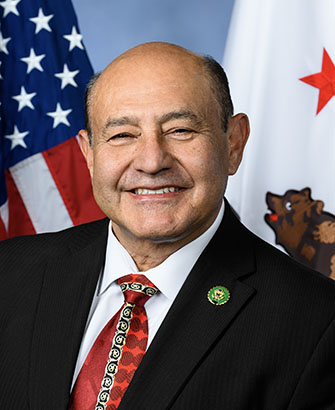 J. Luis CorreaRepresentative, 46th districtDemocratic
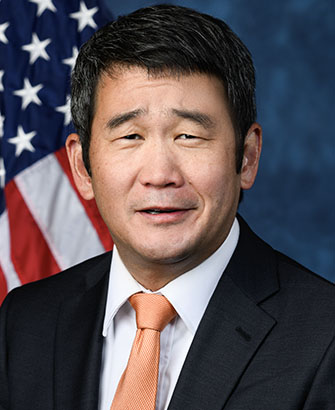 Dave MinRepresentative, 47th districtDemocratic
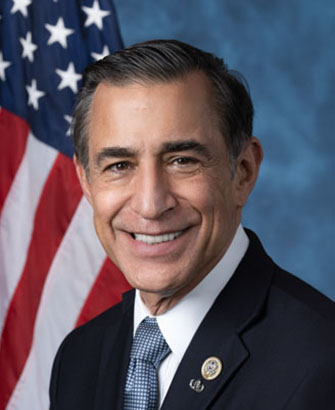 Darrell IssaRepresentative, 48th districtRepublican
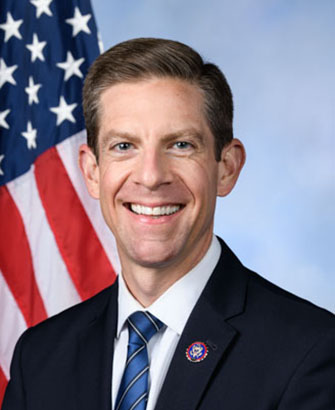 Mike LevinRepresentative, 49th districtDemocratic
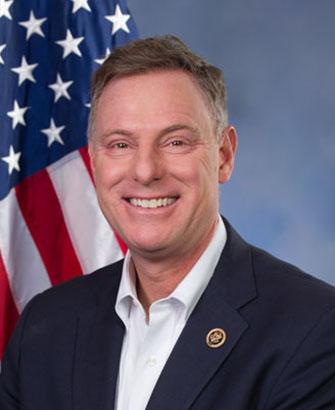 Scott H. PetersRepresentative, 50th districtDemocratic
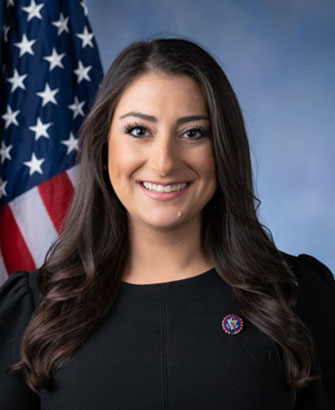 Sara JacobsRepresentative, 51st districtDemocratic
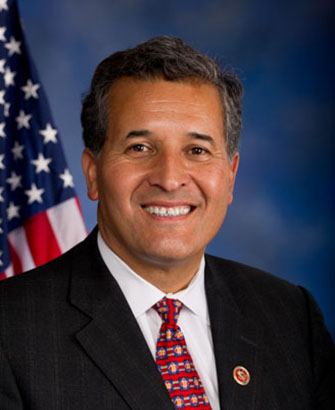 Juan VargasRepresentative, 52nd districtDemocratic
Source: @unitedstates project (public-domain compilation of official congressional records) (retrieved November 21, 2026); Clerk of the U.S. House of Representatives (retrieved November 21, 2026); Biographical Directory of the United States Congress (retrieved November 21, 2026). Sitting members. Anyone elected on November 3, 2026 takes office on January 3, 2027.
Past elections in California
Turnout and results from earlier elections. Open a section to see it.
Voter turnout
Ballots counted in each November general election as a share of people eligible to vote in California.
| Year | Ballots counted | Eligible voters | Turnout |
|---|---|---|---|
| 2024 | 16,140,044 | 26,008,952 | 62.1% |
| 2022 | 11,146,610 | 25,936,947 | 43.0% |
| 2020 | 17,785,151 | 25,840,035 | 68.8% |
| 2018 | 12,712,542 | 25,979,117 | 48.9% |
| 2016 | 14,610,509 | 25,058,420 | 58.3% |
| 2014 | 7,513,972 | 24,413,353 | 30.8% |
| 2012 | 13,202,158 | 23,638,949 | 55.9% |
| 2010 | 10,529,134 | 22,823,850 | 46.1% |
| 2008 | 13,743,177 | 22,270,461 | 61.7% |
| 2006 | 8,899,059 | 21,398,706 | 41.6% |
| 2004 | 12,589,367 | 21,035,883 | 59.9% |
| 2002 | 7,738,821 | 20,529,013 | 37.7% |
| 2000 | 11,142,843 | 19,911,561 | 56.0% |
| 1998 | 8,617,649 | 19,273,427 | 44.7% |
| 1996 | 10,263,490 | 18,653,967 | 55.0% |
| 1994 | 8,900,593 | 18,489,178 | 48.1% |
| 1992 | 11,374,565 | 18,470,965 | 61.6% |
| 1990 | 7,899,131 | 18,145,803 | 43.5% |
| 1988 | 10,194,539 | 17,745,548 | 57.5% |
| 1986 | 7,617,142 | 17,157,466 | 44.4% |
| 1984 | 9,796,375 | 16,614,618 | 59.0% |
| 1982 | 8,064,314 | 16,162,454 | 49.9% |
| 1980 | 8,775,459 | 15,616,072 | 56.2% |
Source: University of Florida Election Lab (retrieved November 21, 2026). Every election from the first year with published figures for this state. Blank years say “not published”.
Presidential election results
Votes cast in California in each presidential general election since 1976, most recent first.
2024 · 15,865,475 votes
- Kamala D. Harris · Democratic58.47% (9,276,179)
- Donald J. Trump · Republican38.33% (6,081,697)
- Robert F. Kennedy Jr. · Other1.25% (197,645)
- Jill Stein · Other1.06% (167,814)
- 3 other entries under 1% each0.90% (142,140)
2020 · 17,500,881 votes
- Joseph R. Biden Jr. · Democratic63.48% (11,110,250)
- Donald J. Trump · Republican34.32% (6,006,429)
- Jo Jorgensen · Libertarian1.07% (187,895)
- 8 other entries under 1% each1.12% (196,307)
2016 · 14,181,595 votes
- Hillary Clinton · Democratic61.73% (8,753,788)
- Donald J. Trump · Republican31.62% (4,483,810)
- Gary Johnson · Libertarian3.37% (478,500)
- Jill Stein · Other1.96% (278,657)
- 2 other entries under 1% each1.32% (186,840)
2012 · 13,038,547 votes
- Barack H. Obama · Democratic60.24% (7,854,285)
- Mitt Romney · Republican37.12% (4,839,958)
- Gary Johnson · Libertarian1.10% (143,221)
- 4 other entries under 1% each1.54% (201,083)
2008 · 13,561,900 votes
- Barack H. Obama · Democratic61.01% (8,274,473)
- John McCain · Republican36.95% (5,011,781)
- 5 other entries under 1% each2.03% (275,646)
2004 · 12,421,353 votes
- John Kerry · Democratic54.31% (6,745,485)
- George W. Bush · Republican44.36% (5,509,826)
- 5 other entries under 1% each1.34% (166,042)
2000 · 10,965,822 votes
- Al Gore · Democratic53.45% (5,861,203)
- George W. Bush · Republican41.65% (4,567,429)
- Ralph Nader · Other3.82% (418,707)
- 4 other entries under 1% each1.08% (118,483)
1996 · 10,019,469 votes
- Bill Clinton · Democratic51.10% (5,119,835)
- Robert Dole · Republican38.21% (3,828,381)
- Ross Perot · Other6.96% (697,847)
- Ralph Nader · Other2.37% (237,016)
- 5 other entries under 1% each1.36% (136,390)
1992 · 11,131,721 votes
- Bill Clinton · Democratic46.01% (5,121,325)
- George H.W. Bush · Republican32.61% (3,630,574)
- Ross Perot · Other20.63% (2,296,006)
- 4 other entries under 1% each0.75% (83,816)
1988 · 9,887,065 votes
- George H.W. Bush · Republican51.13% (5,054,917)
- Michael Dukakis · Democratic47.56% (4,702,233)
- 3 other entries under 1% each1.31% (129,915)
1984 · 9,505,041 votes
- Ronald Reagan · Republican57.52% (5,467,009)
- Walter Mondale · Democratic41.27% (3,922,519)
- 3 other entries under 1% each1.22% (115,513)
1980 · 8,582,938 votes
- Ronald Reagan · Republican52.70% (4,522,994)
- Jimmy Carter · Democratic35.92% (3,082,943)
- John B. Anderson · Other8.62% (739,618)
- Edward "Ed" Clark · Libertarian1.73% (148,390)
- 3 other entries under 1% each1.04% (88,993)
1976 · 7,803,770 votes
- Gerald Ford · Republican49.75% (3,882,244)
- Jimmy Carter · Democratic47.95% (3,742,284)
- 5 other entries under 1% each2.30% (179,242)
Source: MIT Election Data and Science Lab (retrieved November 21, 2026). Where a candidate appeared on more than one party line, the lines are added together. Entries under 1% are grouped.
U.S. Senate election results
The six most recent Senate contests in California through 2024. A runoff, where one was held, decides the seat.
2024 general election · 15,348,846 votes
- Adam B. Schiff · Democratic58.87% (9,036,252)
- Steve Garvey · Republican41.13% (6,312,594)
2024 special general election · 15,041,688 votes
- Adam B. Schiff · Democratic58.75% (8,837,051)
- Steve Garvey · Republican41.25% (6,204,637)
2022 general election · 10,843,650 votes
- Alex Padilla · Democratic61.06% (6,621,621)
- Mark P. Meuser · Republican38.94% (4,222,029)
2022 special general election · 10,771,758 votes
- Alex Padilla · Democratic60.89% (6,559,308)
- Mark P. Meuser · Republican39.11% (4,212,450)
2018 general election · 11,113,364 votes
- Dianne Feinstein · Democratic54.16% (6,019,422)
- Kevin De Leon · Democratic45.84% (5,093,942)
2016 general election · 12,244,170 votes
- Kamala D. Harris · Democratic61.60% (7,542,753)
- Loretta Sanchez · Democratic38.40% (4,701,417)
Source: MIT Election Data and Science Lab (retrieved November 21, 2026). Primary elections are not included. Entries under 1% are grouped.